Disparities in Entrepreneurship
Parity Analysis – Black or African American Owned Businesses
Fond du Lac, Outagamie, and Winnebego Counties
Fond du Lac Outagamie Winnebago
![]() Percent Population-Black or African American
Percent Population-Black or African American
![]() Share of Firms- Black or African-American Owned
Share of Firms- Black or African-American Owned
![]() Share of Employment in Black or African American Owned Businesses
Share of Employment in Black or African American Owned Businesses
![]() Share of Sales/Receipts by Black or African American Owned Businesses
Share of Sales/Receipts by Black or African American Owned Businesses
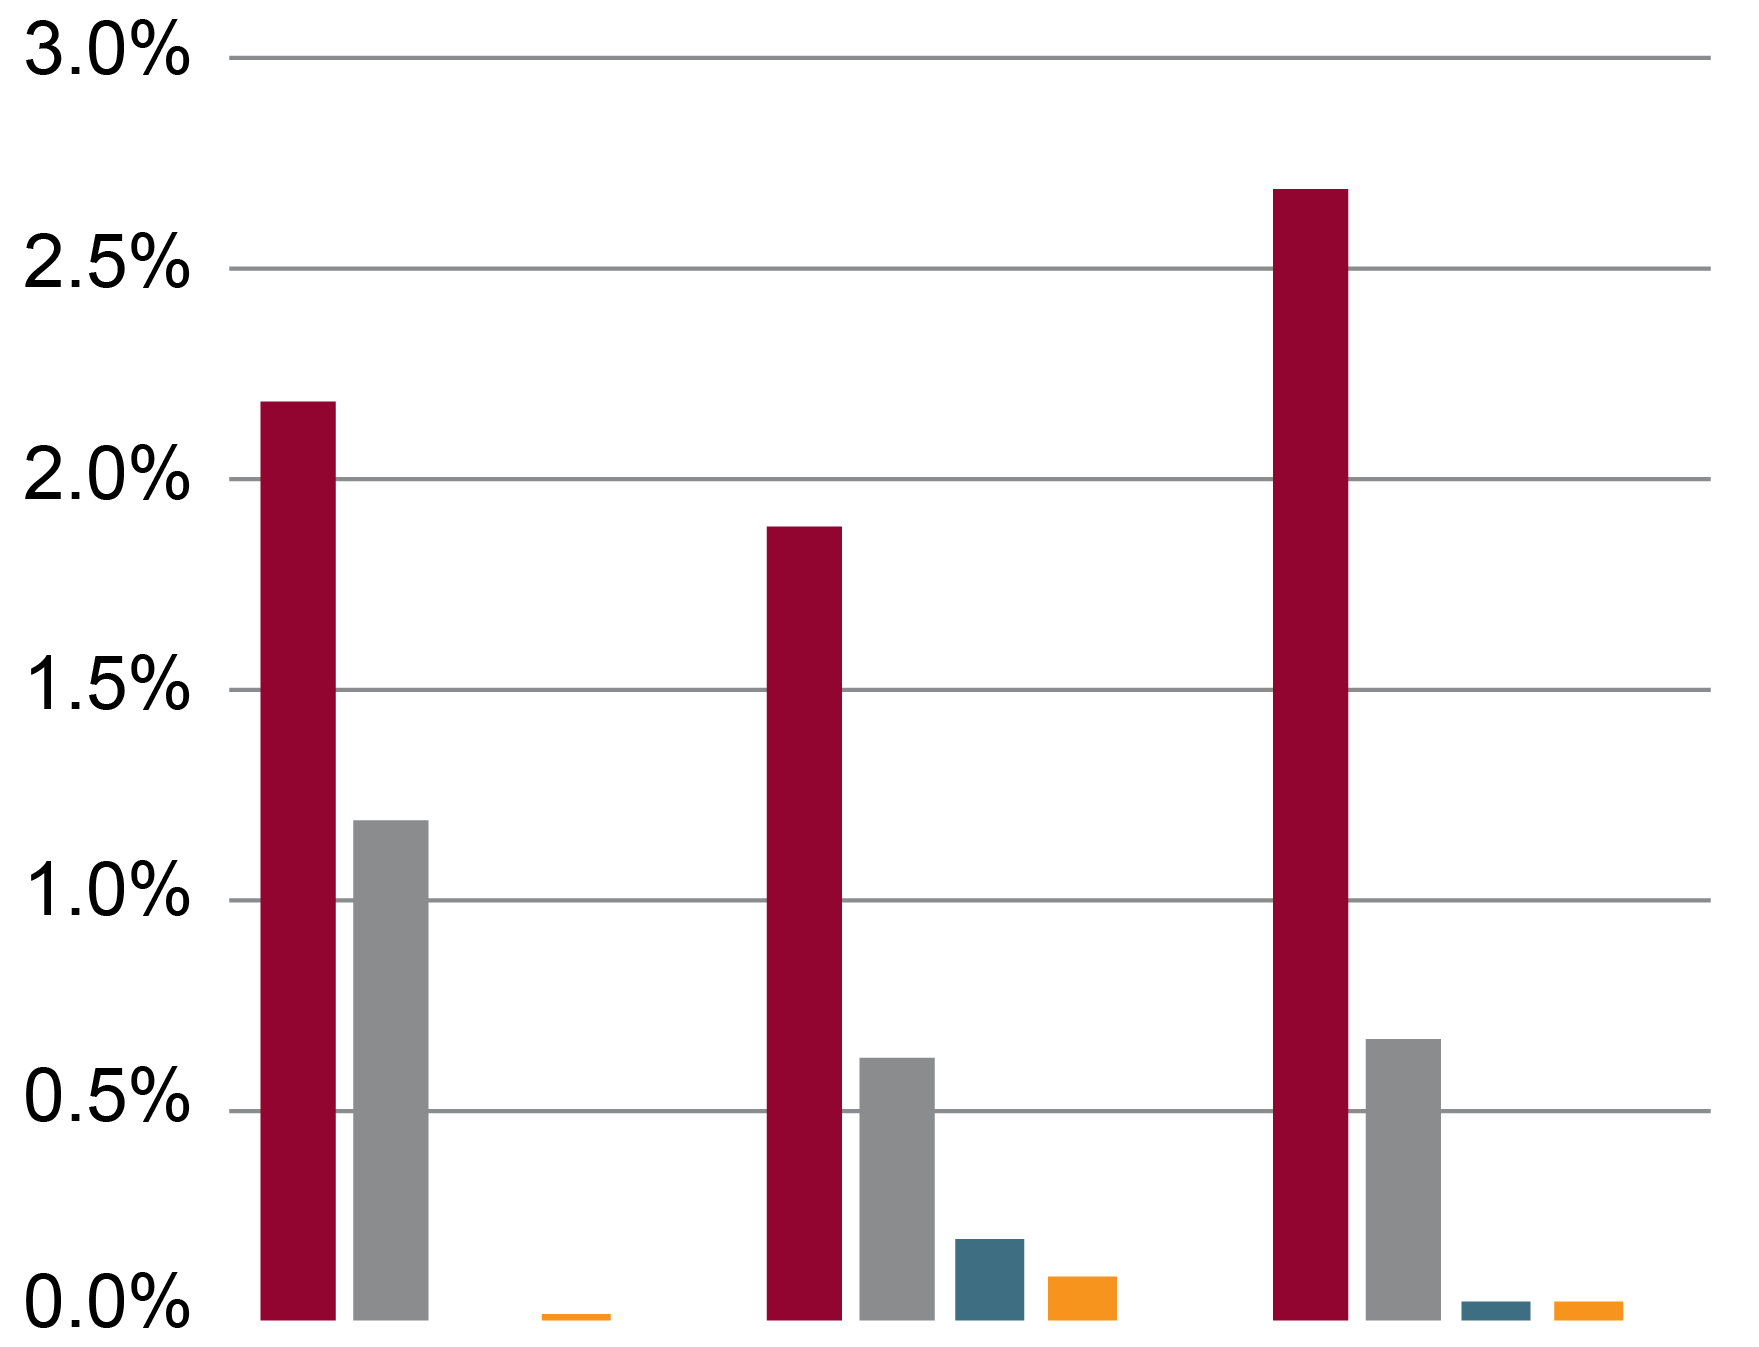
This chart shows 4 data points that indicate African American entrepreneurs struggle in Northeast WI. The red bar is the percent of the total population that is Black. The gray bar is the percent of businesses that are Black-owned. The blue bar (missing in Fond du Lac County) shows the percent of employees in each county that work in Black-owned firms. The orange bar is the amount of sales from Black-owned firms.
If all individuals were equally prepared and supported in entrepreneurship, we would expect the blue bar (percent of the population) to match all the other bars, demonstrating that each racial group was performing at the highest level possible for their proportion of the population. Since that is not the case in Northeast WI, Extension is focusing on educational interventions with African American entrepreneurs and economic development professionals so that increased economic gain, and economic equity, are possible here.